07 November 2025
 Share
Share
1
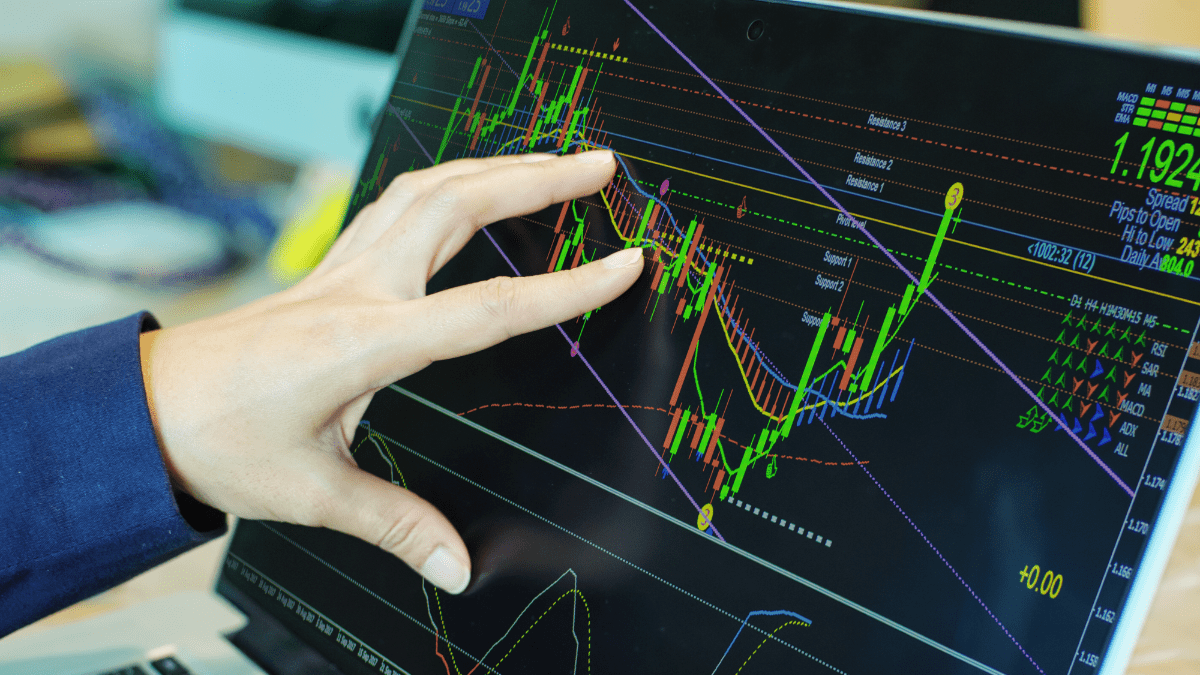
Technical analysis is a method used to evaluate and forecast future price movements of cryptocurrencies by studying historical market data, primarily price and volume. Unlike fundamental analysis, which focuses on the intrinsic value of a project, or psychological analysis, which examines investor sentiment and market behavior, technical analysis centers purely on chart patterns and statistical trends.
It assumes that all known information is already reflected in the price and that price movements tend to follow established patterns that repeat over time.
Its main purpose is to help traders make data-driven decisions about entry and exit points in the market. Rather than relying on speculation or emotions, it offers a structured approach grounded in numbers and visual interpretation. Technical analysis serves as a complementary tool, not a replacement, for a complete crypto analysis strategy, working best when combined with both fundamental insights and psychological awareness.
The advantages of technical analysis include:
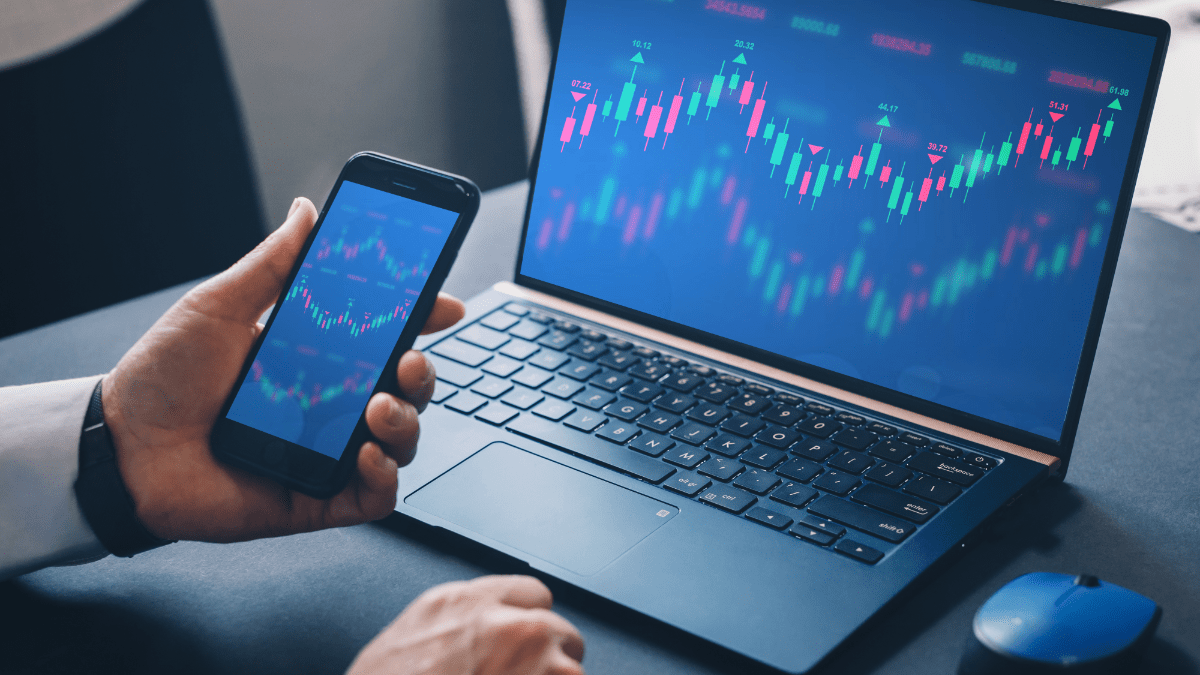
Whether trading Bitcoin, Ethereum, or smaller altcoins, the same analytical principles apply. By learning to interpret crypto charts, investors can understand where momentum is building, identify potential reversals, and manage risks more effectively. Ultimately, technical analysis empowers traders to make smarter, evidence-based decisions, especially in the volatile world of digital assets.
Get 100 $ bonus on Binance right now
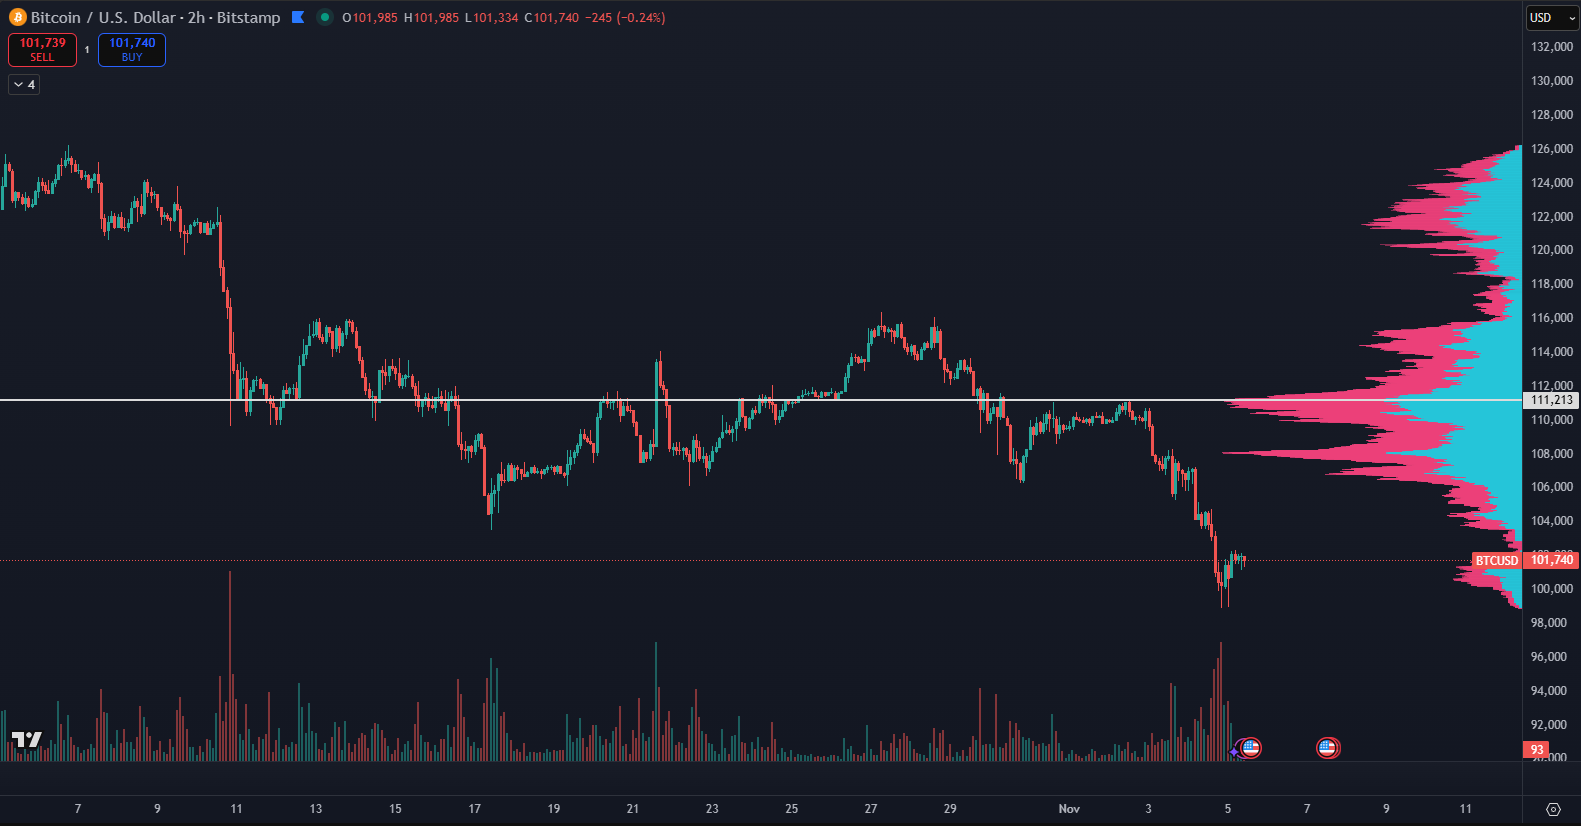
At the heart of technical analysis lies the candlestick chart, also known as the OHLC chart (Open, High, Low, Close). Each candlestick represents a specific time period, such as one minute, one hour, or one day, and contains four essential data points:
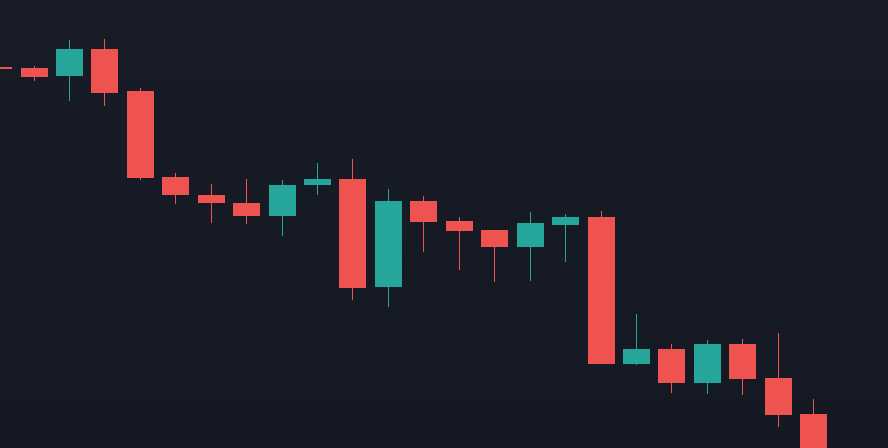
The body of the candle represents the range between open and close prices. If the close is higher than the open, the candle is typically green (bullish), signaling upward momentum. If the close is lower, the candle is red (bearish), indicating downward pressure. The thin lines extending from the body are called wicks or shadows, showing the highs and lows reached during the session.
Candlestick charts are preferred by most traders because they offer visual clarity, a quick way to see who’s in control of the market, bulls or bears. Compared to line or bar charts, they provide more detailed insight into intraday volatility and momentum shifts. Reading candlestick charts effectively allows traders to detect market sentiment at a glance and anticipate possible reversals or breakouts. In crypto trading, where prices move fast, mastering the candlestick chart is the foundation of every technical decision.
A crucial step in technical analysis is understanding trends- the general direction in which the market is moving. There are three primary types:
To identify a trend, traders look at price structures, draw trendlines, and use moving averages as confirmation. The strength of a trend can be gauged by how consistently price respects its direction and how often it bounces off support or resistance zones. When price pulls back but doesn’t break key levels, the trend remains strong.
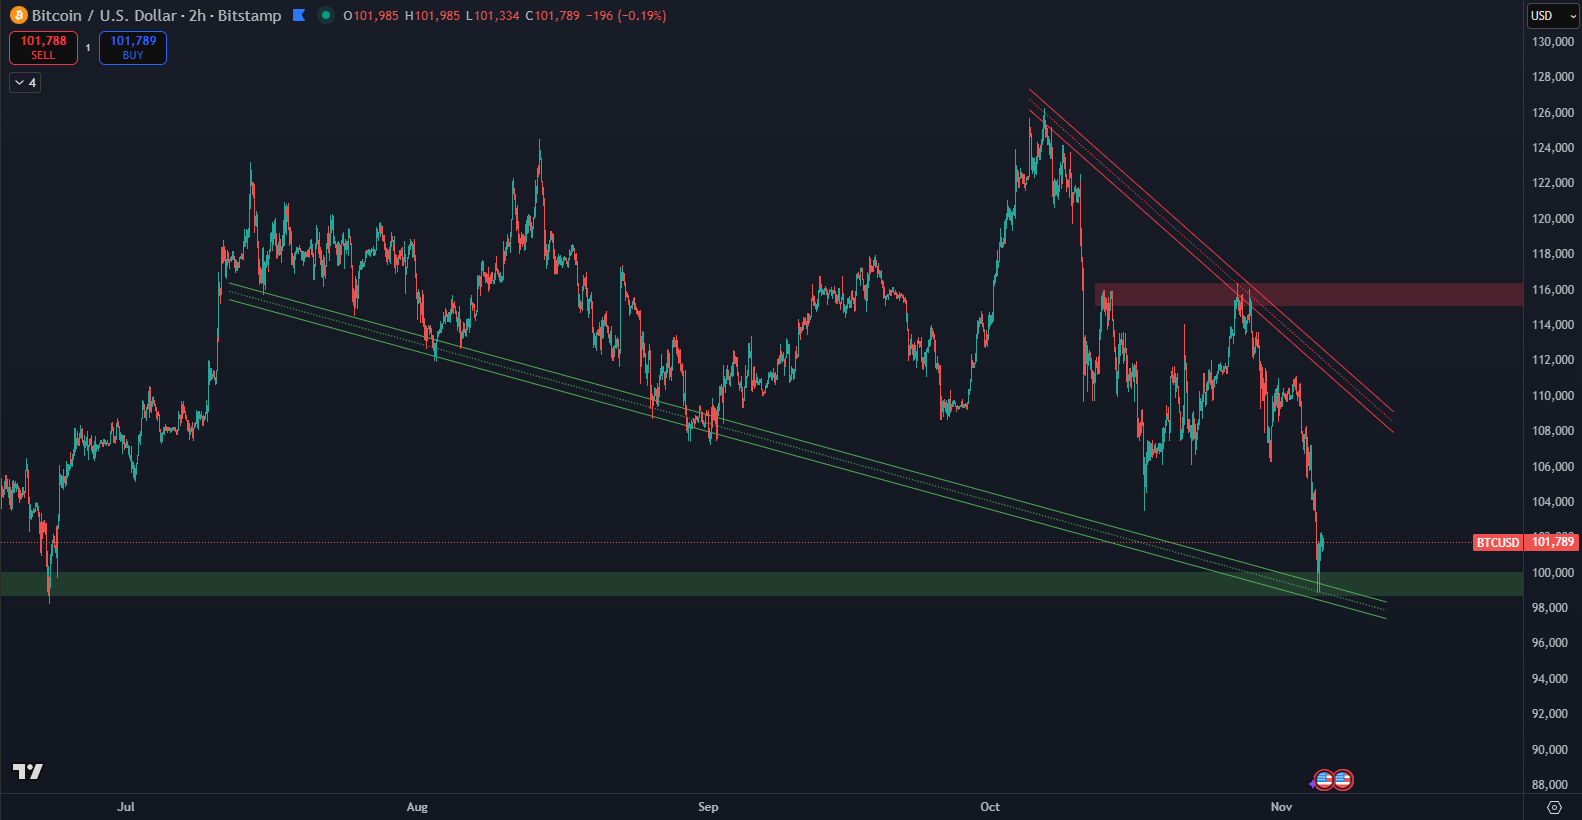
Recognizing these levels is vital for effective risk management. Traders often place take-profit orders near resistance zones and stop-loss orders below support levels to minimize losses. When price breaks through resistance, it may signal a bullish breakout, while falling below support could mark a bearish reversal.
Understanding how to draw and interpret these levels gives traders a roadmap of possible future movements. It’s not about predicting exact outcomes but about managing probabilities – knowing where the market is most likely to react.
Beyond single candles, candlestick patterns offer deeper insight into market psychology. These patterns form when multiple candles combine to reveal potential trend reversals or continuations. Reading them correctly can provide early signals for entering or exiting trades. Candlestick patterns reflect the battle between buyers and sellers. A sudden shift in dominance often precedes a major move.
Here are three classic examples every beginner should learn:
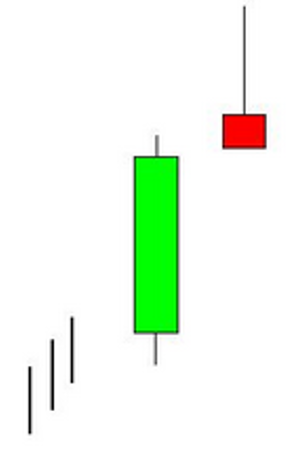
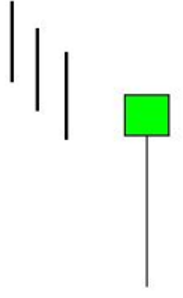
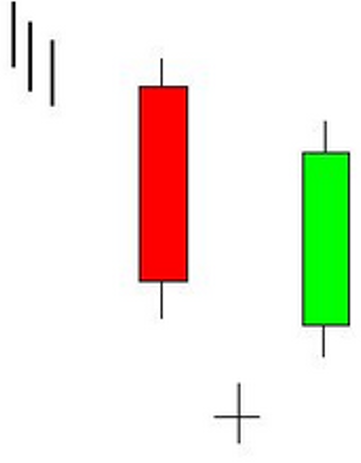
Recognizing these patterns is not about perfection but about probability. The more confluences a trader finds – like matching patterns, trendlines, and volume confirmation – the stronger the signal becomes. In crypto markets, where volatility amplifies every move, these visual cues are invaluable for anticipating short-term shifts and building confidence in trade setups.
Another essential part of technical analysis is using technical indicators – mathematical calculations based on price, volume, or momentum. Indicators don’t predict the future. Instead, they confirm or support what the chart already suggests. They act as supplementary tools that help refine entries and exits, offering additional layers of confirmation.
Here are three of the most widely used indicators in crypto trading:
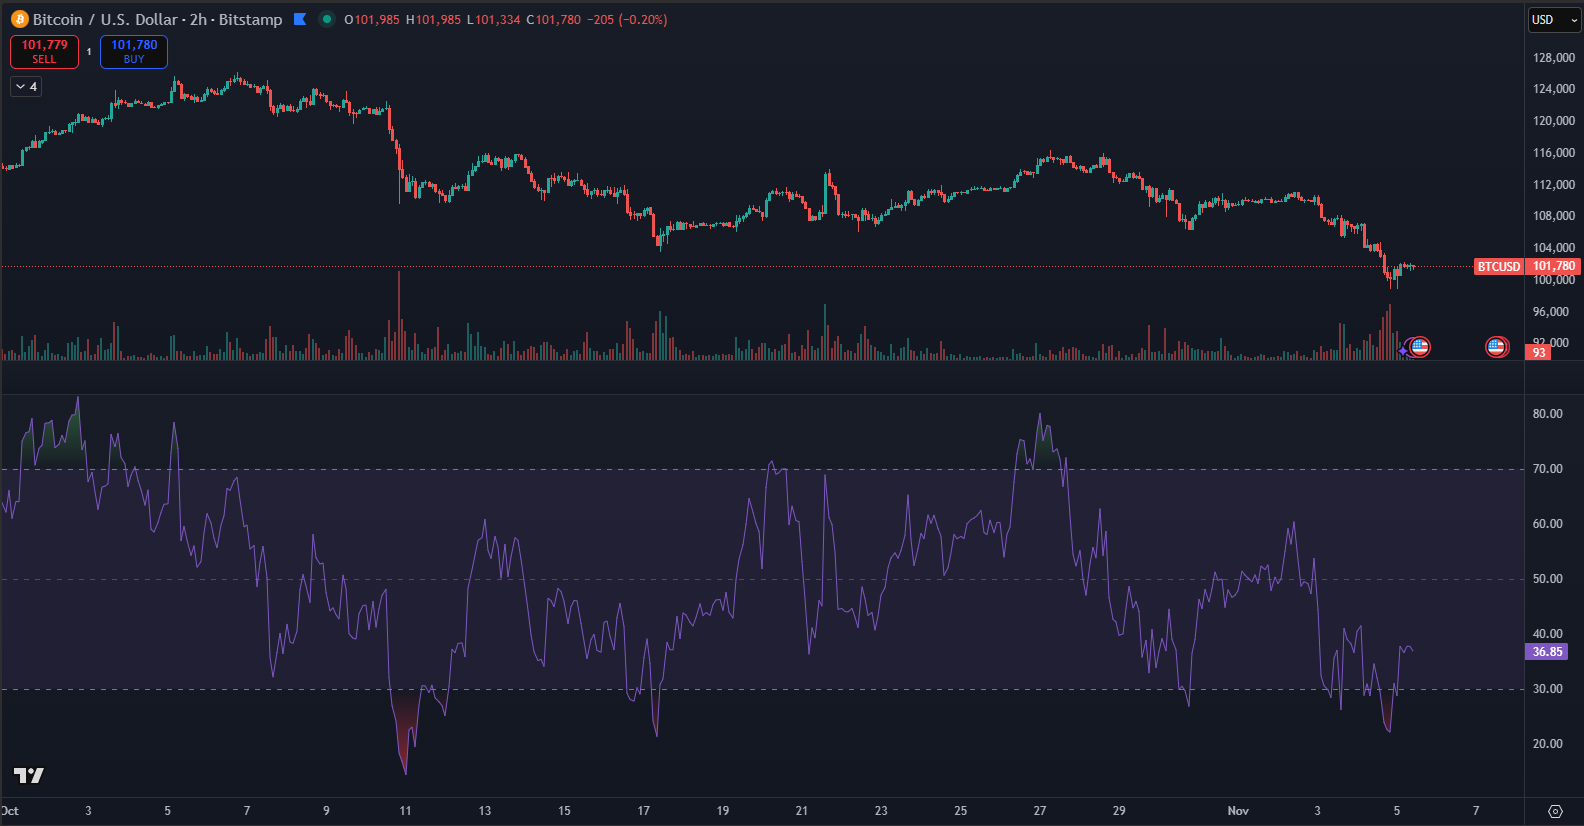
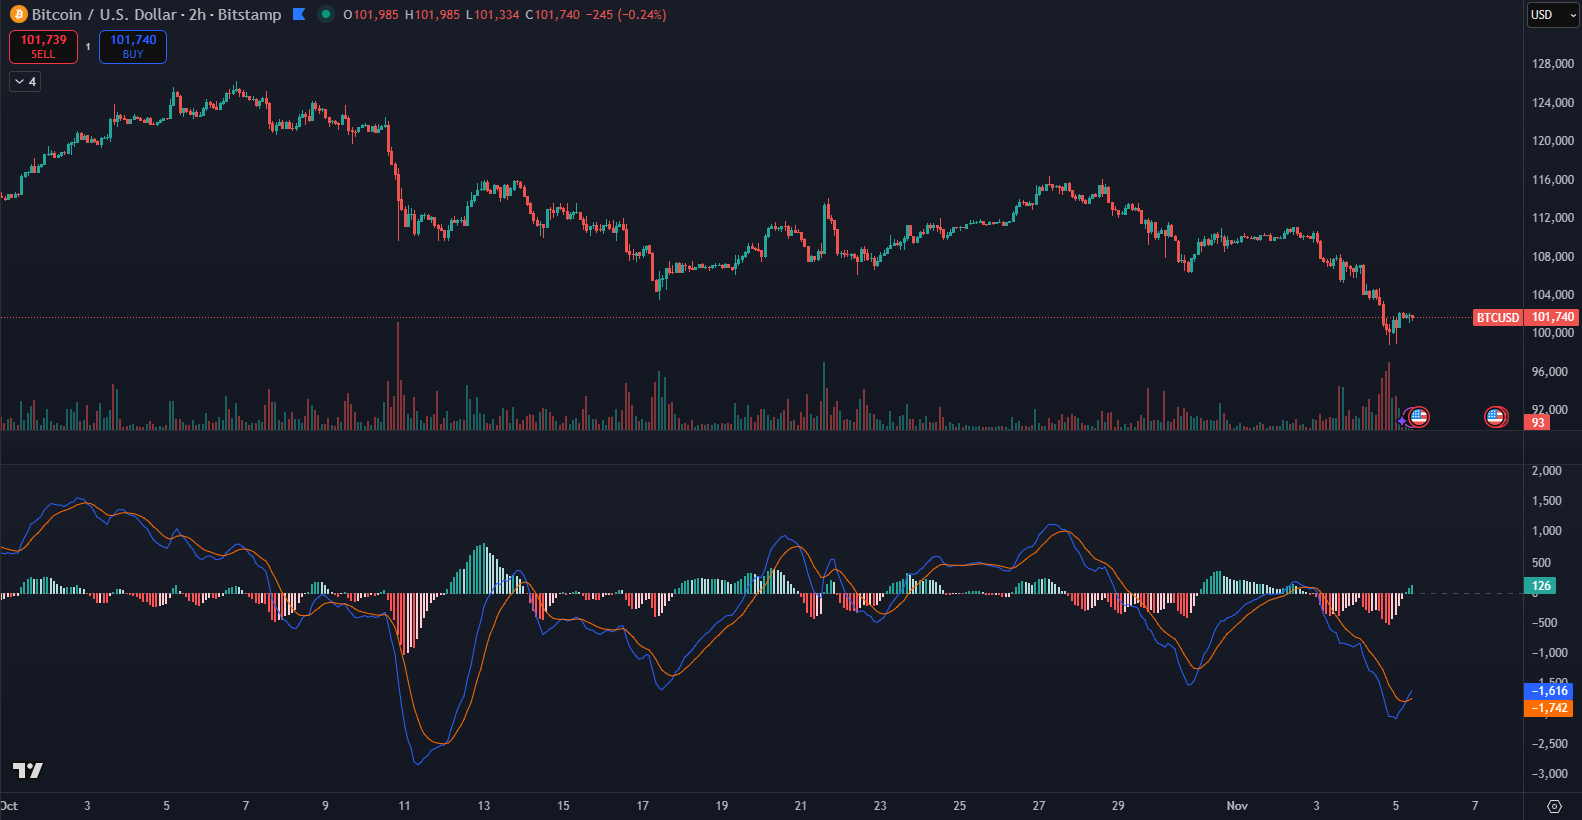
While indicators are powerful, traders must remember they are not foolproof. Overreliance can lead to false signals, especially in highly volatile crypto markets. The best approach is to use indicators in combination with trendlines, support and resistance levels, and candlestick patterns for well-rounded decision-making.
Together, these elements create a comprehensive technical analysis framework, allowing traders to navigate the unpredictable world of cryptocurrencies with greater confidence, precision, and control.