03 December 2025
 Share
Share
1


Bitcoin is returning to significant support areas after a long correction period. On the daily chart, according to TradingView, BTC is forming a significant reversal that investors have been waiting for practically since the market left its all-time high.
The key element of this situation is the emergence of the 123 bottom formation reversal pattern. This pattern in technical analysis is considered a fairly reliable sign of a reversal. Its essence lies in the formation of two consecutive rising lows on the chart, where their order and shape give the pattern directional significance.
When the first bottom (point 1) forms, it is not yet a clear signal. But if the market refuses to go lower during the next correction and forms a second higher low (point 3), it provides the first indication that selling pressure is weakening. An important addition to this pattern is point 2 – a local maximum formed between the two lows, representing a kind of threshold that the price must surpass for the signal to be considered valid.
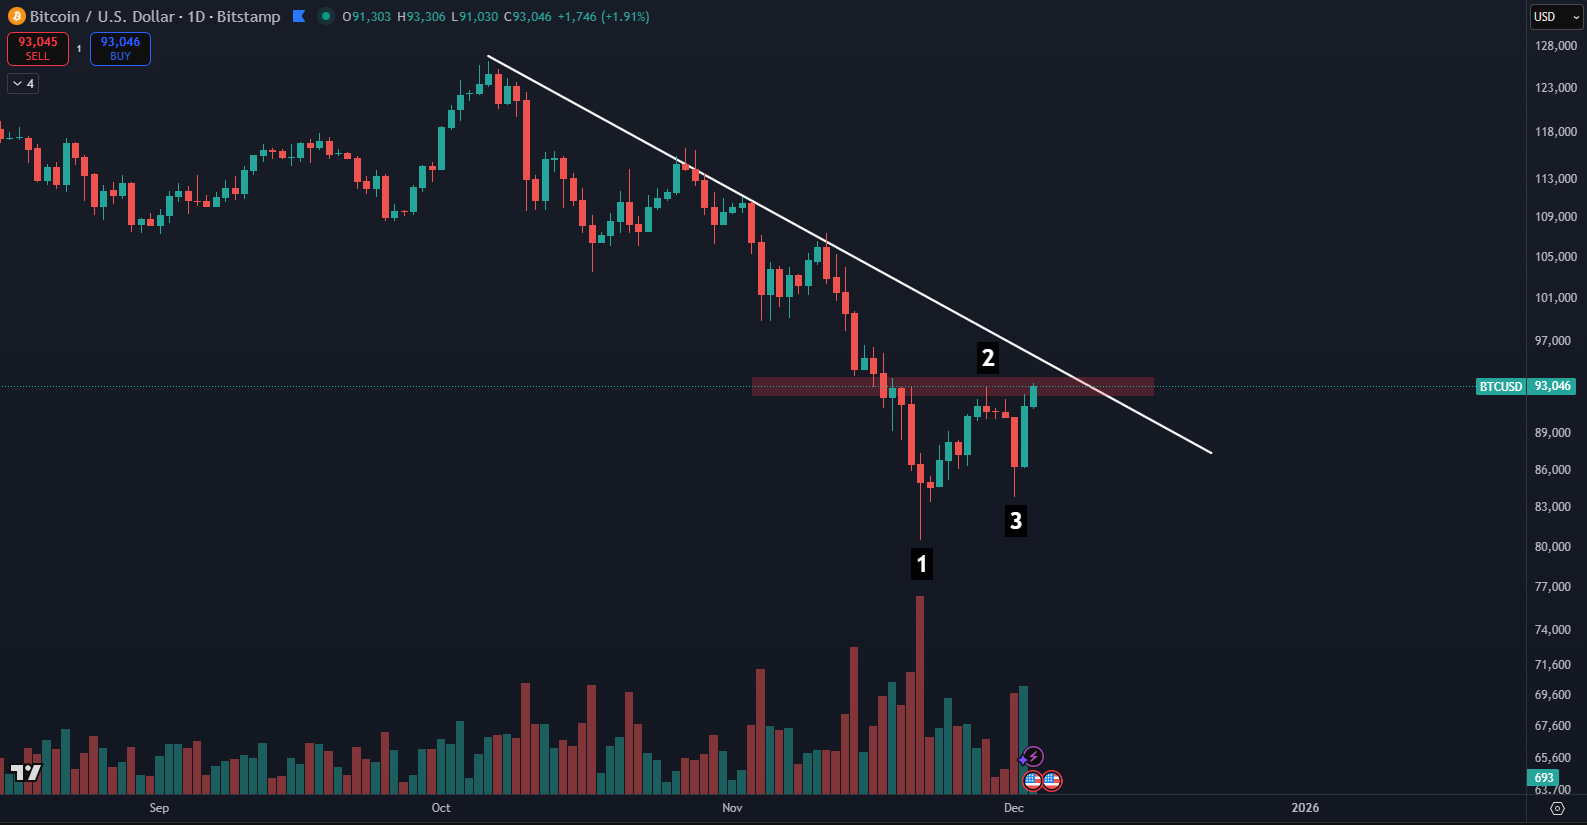
Today, Bitcoin is approaching the possibility of closing a candle above the high (point 2), which could confirm the reversal trend and the overall development. If this trend reversal is confirmed, it would be an ideal buying signal that you can use on the Binance exchange and also receive a $100 bonus.
Buy Bitcoin after a dip on Binance and get a $100 bonus
The 123 bottom formation reversal pattern has a solid place among traders. Mainly because it can capture subtle shifts in market dynamics before a clear breakout of important barriers occurs. If the rising lows confirm the shift in pressure, surpassing point 2 represents a definitive impulse, often accompanied by the development of a new trend.
In the current market situation, all focus is on the resistance area between $93,000 and $95,000. This zone is significant not only due to its historical placement but also because it intersects with the descending trend line. This line has accompanied the entire correction phase. Thus, it forms a double barrier that will not be easy to break.
If the price fails to hold above this level, it would indicate that the correction process is still not over. The market would then seek new support levels. However, if Bitcoin successfully breaks through this resistance, it would not only confirm the rising lows but also provide a clear signal that the market has decided to return to a bullish trajectory.