17 June 2025
 Share
Share
1

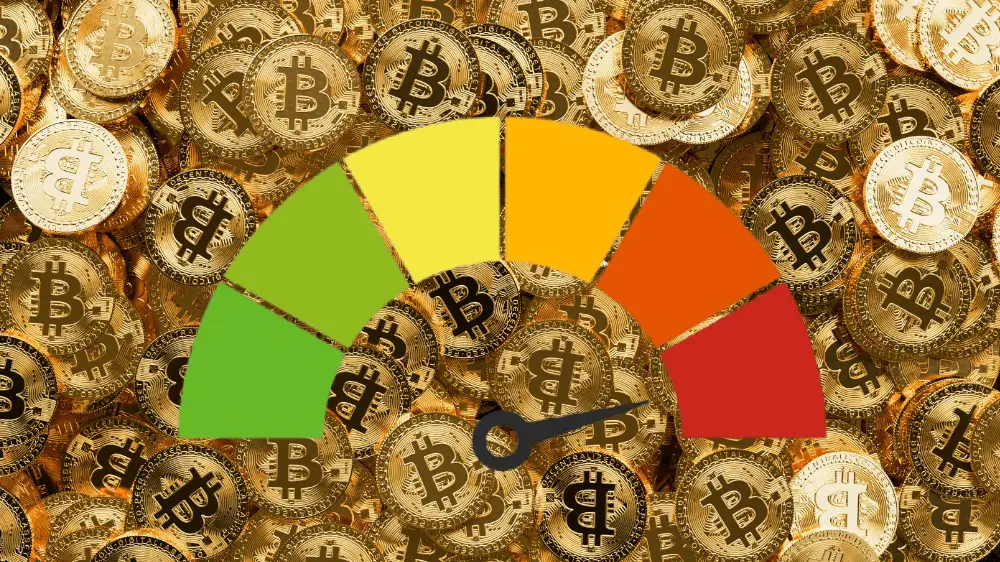
Greed is shown on the chart as a green curve and traditionally signals slightly overheated market growth. However, it’s important to realize that historical price peaks of Bitcoin were always accompanied by blue color, which expresses extreme greed.
Currently, even though Bitcoin is trading just a few thousand dollars below its all-time high, we’re not yet at this stage. This means that there’s still room for growth and euphoria hasn’t prevailed yet.
At the turn of 2024 and 2025, when Bitcoin first crossed the $100,000 threshold, sentiment immediately indicated a possible peak. Today, while we’re at the same price level, market sentiment is much more stable and balanced. This is because Bitcoin has been at these levels before, so the market perceives them with greater calm and less emotion than a few months ago.
The Realized Profit/Loss Ratio metric for long-term holders reached 9.4 million, meaning a significant portion of Bitcoin supply held long-term is being sold at a profit.
This data signals a market phase that is typical for the peak of euphoria – a state when most investors are in profit and willingly realize gains. At the same time, it’s a phase that, according to historical data, often precedes the culmination of a bull market.
Interestingly, however, with sufficient inflow of new capital and interest, such a phase can last several months before an actual reversal occurs.
Bitcoin, according to all available indicators, is entering the final phase of the growth cycle. Despite being the last stage, this phase often stretches for several months if supported by liquidity and investor interest.