10 September 2025
 Share
Share
1
Bitcoin has experienced a significant correction of 14%, raising questions among investors about the future market trend. However, since the beginning of September, the trend has gradually reversed, and according to TradingView, the price has risen from a low of $107,400 to the current $111,400. This movement suggests that the decline may have reached its bottom, opening the door for possible consolidation or renewed growth.
During such moments, on-chain data plays a key role, providing deeper insights into investor behavior, accumulation zones, and demand strength signals. Let’s take a closer look at what the latest metrics from Glassnode reveal.
After reaching a historic high in mid-August, Bitcoin experienced a sharp drop to $107,400, then rebounded to around $111,000. The question remains whether this is the beginning of a bear market or just a short-term correction. A key tool for assessing the situation is the UTXO Realized Price Distribution (URPD) metric, which reveals the prices at which investors purchased their coins.
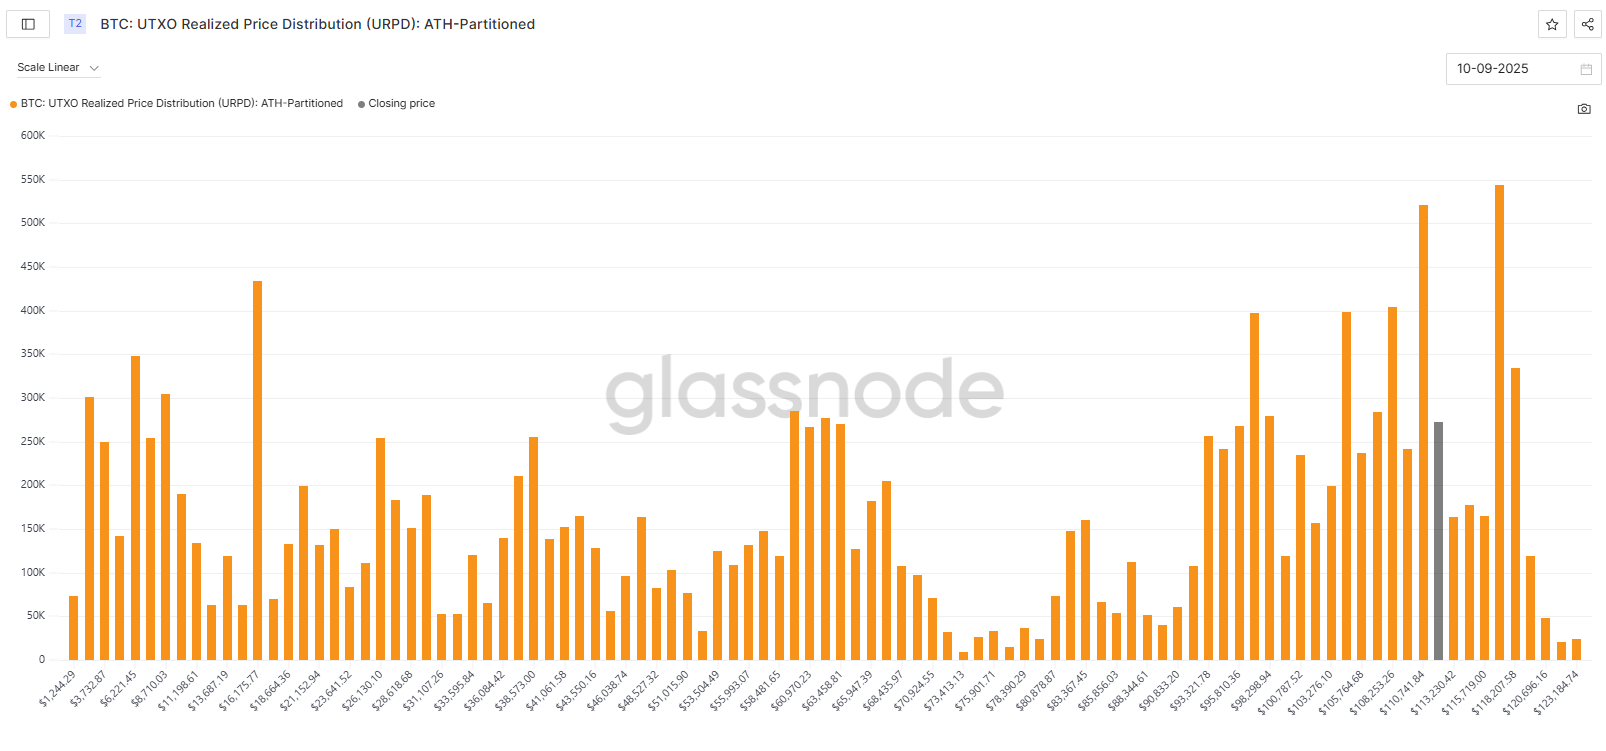
Data shows that since August 13, investors have focused on the price range of $108,000 – $116,000. This area, originally perceived as a “gap,” has gradually filled through accumulation. This indicates a “buy the dip” behavior, showing investors’ confidence in the long-term growth of Bitcoin. On the other hand, short-term risks of further weakening still exist.
While URPD indicates positive investor behavior, the broader cyclical picture points to potential demand exhaustion. The mid-August surge was already the third recurring euphoric phase in this cycle. Lasting approximately 3.5 months, it showed that maintaining such a state requires a constant influx of capital. When demand weakened, Bitcoin’s price fell below the level where 95% of the supply was in profit on August 19.
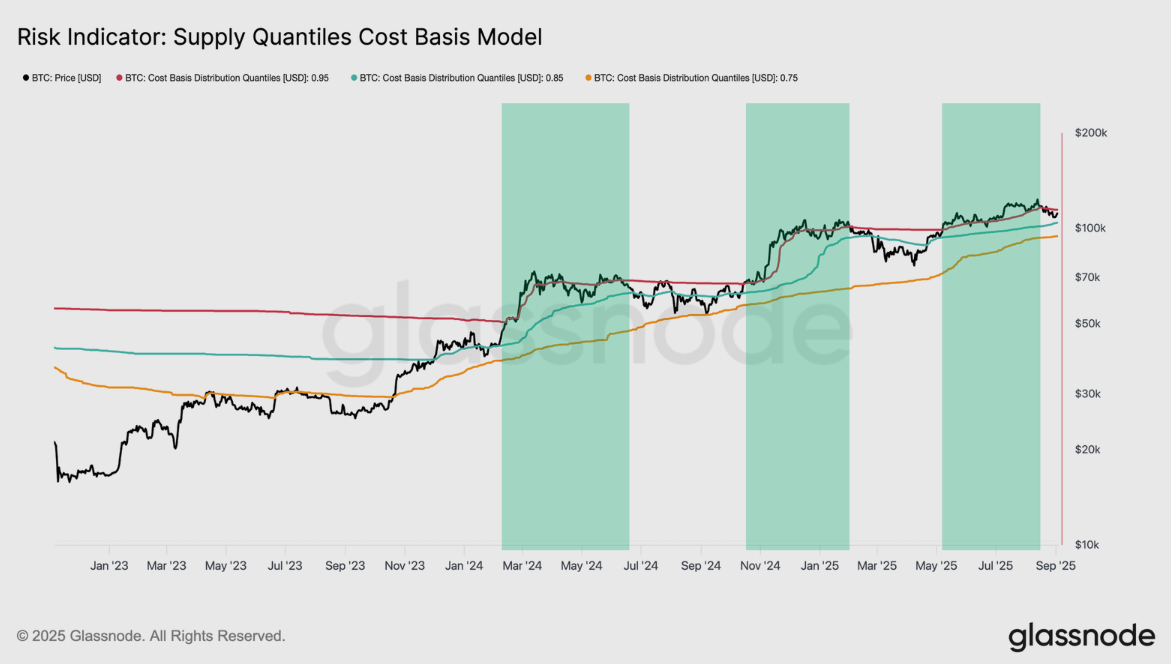
Currently, the price is within the 0.85 – 0.95 quantile cost basis range, i.e., between $104,000 – $114,000. Historically, this range has often served as a consolidation zone after sharp rallies. If Bitcoin falls below $104,000, it could indicate a repeat of exhaustion phases known from the past. Conversely, a rise above $114,000 would signal that demand is regaining dominance and that the trend has a chance to stabilize.
If you are wondering where to buy Bitcoin, a reliable choice is the Binance exchange. It offers a simple interface, low fees, and high security. Registration is fast, and deposits are available via card or bank transfer. Binance is suitable for both beginners and experienced investors seeking a convenient and secure way to buy cryptocurrencies.