10 October 2025
 Share
Share
1

Bitcoin has once again attracted investors’ attention with its long-term model, known as the Bitcoin Rainbow Chart, which visualizes historical price performance through color-coded sentiment bands. According to the magazine Finbold, this logarithmic growth model suggests that Bitcoin could trade between $37,627 and $419,225 by October 31, 2025, depending on market sentiment and its phase within the cycle.
Currently, Bitcoin is trading around $122,000, placing it in the “HODL” band, which ranges between $111,040 and $145,283. This zone indicates steady confidence among long-term holders without signs of excessive optimism.
At the lower end of the chart are the “fire sale and buy opportunities” bands, covering prices between $37,627 and $66,483. These levels are historically associated with undervaluation. The mid-range of the chart includes the “accumulate” and “HODL” bands, ranging from $85,880 to $145,283, typically representing market equilibrium and moderate optimism.
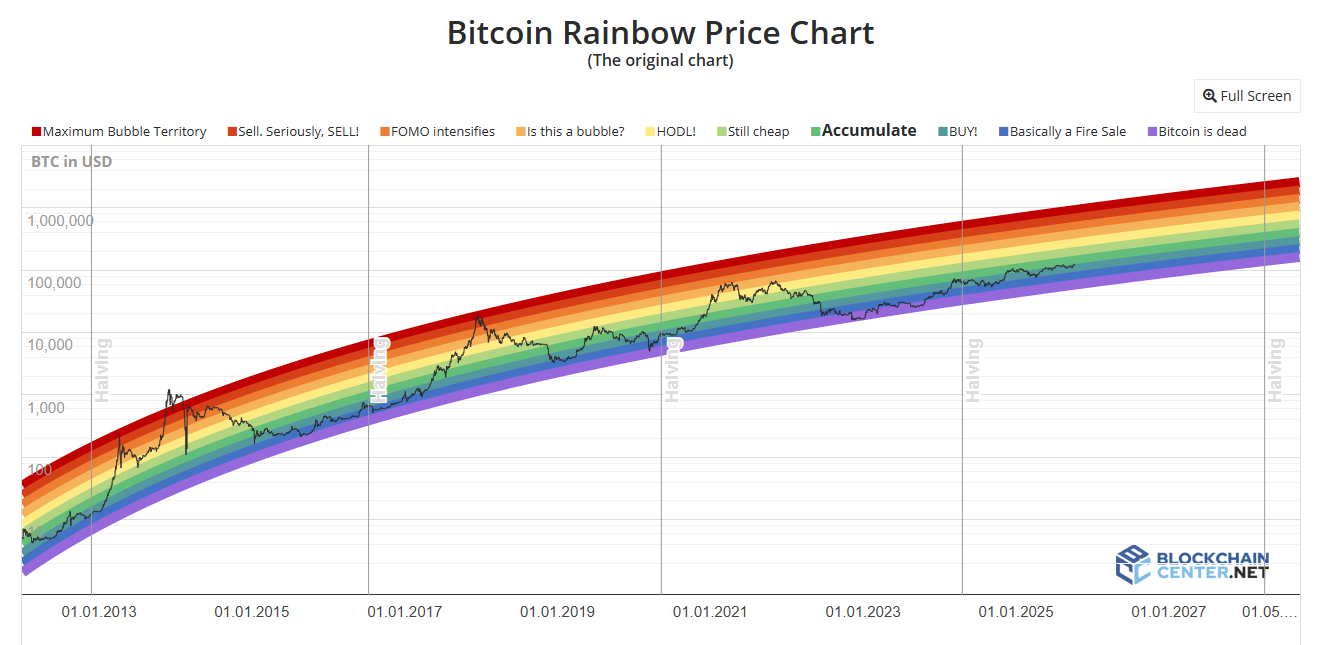
The upper bands of “bubble and FOMO intensifies” cover the range from $164,884 to $419,225, typical for market peaks.
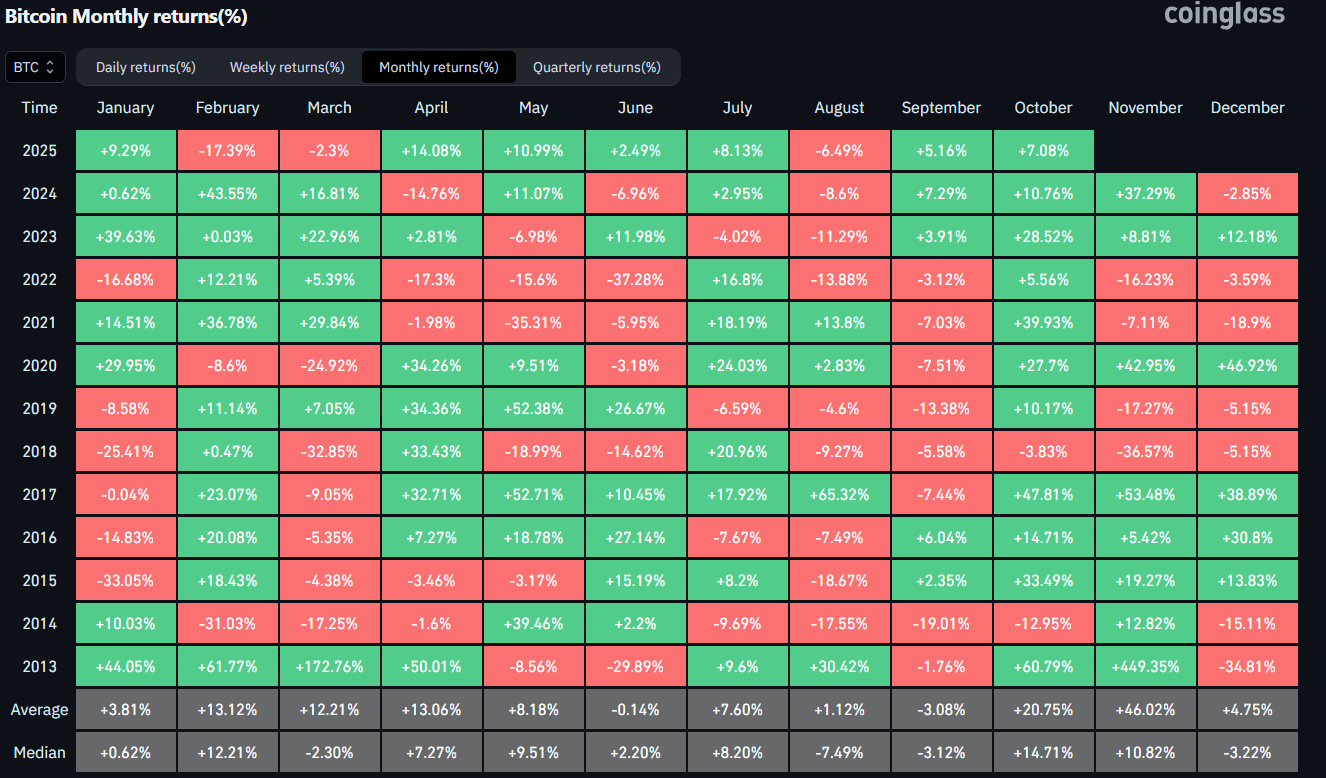
Realistic expectations for Bitcoin in October remain positive, with predictions around $135,000. This estimate is based on historical data from Coinglass, which shows Bitcoin’s average monthly performance in October at approximately 20%. If this trend repeats, Bitcoin could continue a steady upward trajectory, maintaining confidence among long-term investors without signs of market overheating.
Bitcoin reached a new all-time high of $126,200 over the past weekend, confirming continued positive sentiment. According to the Rainbow Chart model, the market is still in a healthy zone, reflecting a balanced ratio between demand and supply.
This growth is largely driven by institutional capital inflows into exchange-traded funds (ETFs), led by managers like BlackRock and other major players from traditional finance.
At the time of writing, Bitcoin is consolidating around $122,000 according to TradingView, after a slight daily decline of 1.05%. On a weekly basis, however, its price has increased nearly 10%, indicating growing investor confidence.