20 November 2025
 Share
Share
1

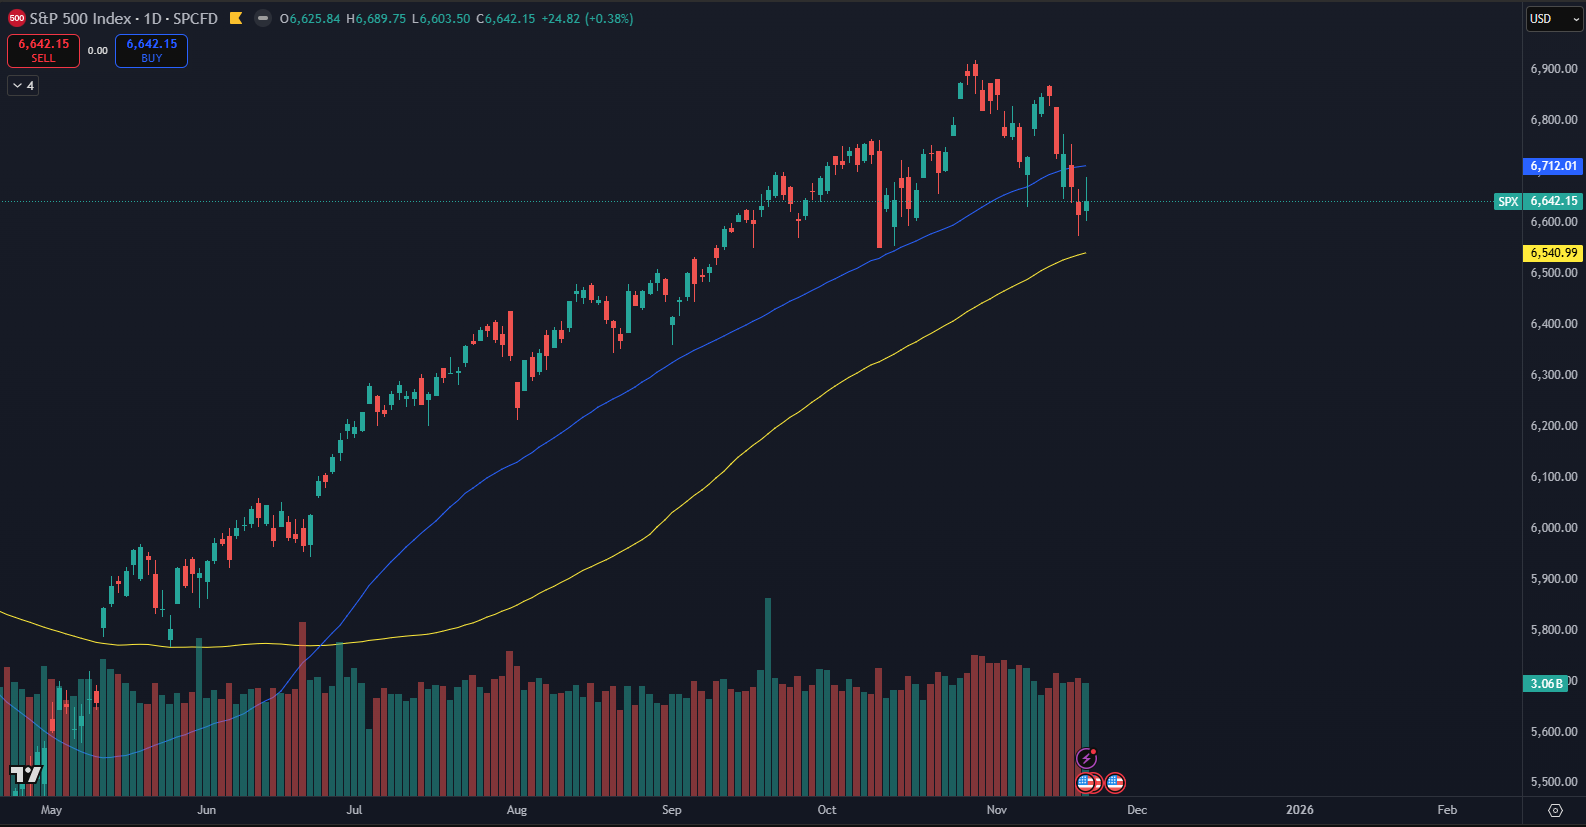
The stocks of the U.S. S&P 500 index have entered an environment where short-term optimism clashes with the reality of weakening momentum. Analysis by TradingView shows that a drop below the 50-day moving average is not just a routine fluctuation. A decline accompanied by closing below this level signals that the market is losing the pace that recently drove its growth.
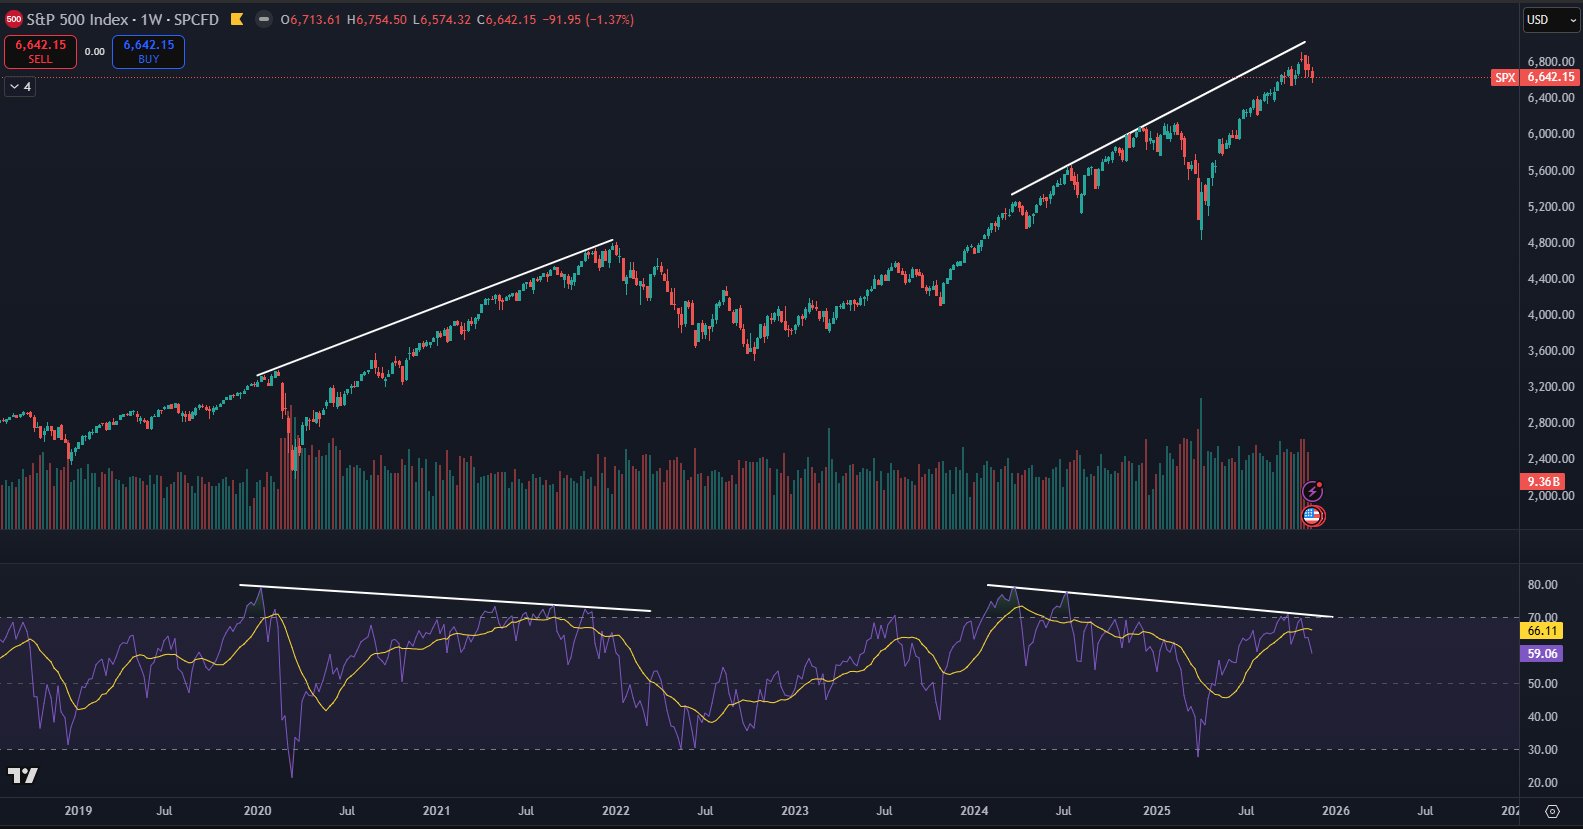
The index is hovering around 6,642 points, representing approximately a 4% drop from its all-time high. While this may not seem dramatic at first glance, it is crucial to consider the broader context.
The weekly RSI has been showing lower peaks for several weeks, while the price has been creating higher highs. This contrast is often a ticking time bomb. Momentum is fading from the market, even though the chart still appears stable on the surface. A similar situation occurred at the end of 2021, when the divergence foreshadowed only a last short-lived rally before a major downturn, which eventually led to the bearish year of 2022.
On XTB, you can set a permanent order to buy stocks
Attention is also on the 100-day moving average. In recent months, it has served as a key support from which the market repeatedly bounced. If the price closes below this level by the end of the week, it would signal structural weakening. Historically, such a break often triggered a transition from a growth phase to a longer period of declines.
Current calculations indicate that a wider buying zone may form between 5,300 and 5,000 points if the recent peak confirms as lasting. You can take advantage of falling stocks via the XTB platform, which provides easy tools for quick purchases, trend monitoring, and effective long-term position building.
However, if the index reaches a new high again, the potential correction range would shift higher. Despite growing caution signals, part of Wall Street still believes the market can rise to the 7,000-point mark. This division of opinions creates an environment where investors must make decisions extremely carefully, as technical indicators and sentiment no longer move in the same direction.